SOC 2 risk assessment with AI: 42 risks in structured YAML
A functioning risk register has an ID, description, category, likelihood, impact, treatment plan, and mitigating controls for every single risk. Most companies track this in sprawling spreadsheets. We use structured YAML and AI to maintain 42 risks across three categories.

Quick answers
What does a SOC 2 risk assessment include? Each risk needs an ID, description, category, likelihood, impact, treatment plan, and mapping to mitigating controls.
How does AI help with risk assessment? AI structures and categorizes risks, maps them to controls, and maintains the risk register in machine-readable format.
How many risks should you track? We track 42 across three categories: People, Technical, and Policy. The number matters less than the coverage.
42 risks. Each with an owner, a treatment plan, and controls that mitigate it. That is what a functioning risk register actually looks like.
Not a vague spreadsheet with color-coded cells and half-empty columns. Not a compliance platform’s auto-generated risk list that nobody reads after setup. A living document where every identified risk connects to specific controls, carries an assessed severity, and has a clear treatment strategy.
At Tallyfy, we maintain our entire SOC 2 risk assessment in YAML files inside a Git repository. When our auditors need to verify that we’ve identified and assessed risks per CC3.1 and CC3.2 of the Trust Services Criteria, we point them at structured data that hasn’t been corrupted by someone accidentally deleting a row in Excel.
This is the approach we use across our entire SOC 2 compliance system. Here’s how the risk assessment piece works.
What a risk assessment actually requires
SOC 2 auditors don’t want a casual list of things that worry you. The AICPA’s Common Criteria spell out what a proper risk assessment demands. CC3.1 requires you to specify objectives clearly enough that you can identify risks against them. CC3.2 requires you to identify those risks across the entire entity and analyze them as a basis for deciding how to manage each one.
In practice, every risk in your register needs these fields:
- A unique identifier. Not “Risk 1” or “R-047.” Something descriptive that tells you what the risk actually is.
- A plain-language description. What could go wrong and why it matters.
- A category. Grouping risks makes patterns visible. You can’t spot gaps if everything sits in a flat list.
- Likelihood and impact scores. How probable is this risk? How bad would it be? Auditors expect a documented scoring methodology that you apply consistently.
- A treatment strategy. Are you controlling it, transferring it, accepting it, or avoiding it altogether?
- Mitigating controls. Which specific controls reduce this risk to an acceptable level?
- Current status. Is the risk mitigated, open, or under review?
Here’s what a single risk entry looks like in our YAML register:
- id: change-management
  name: Change Management
  description: Changes without appropriate oversight introduce vulnerabilities
  treatment: CONTROL
  status: MITIGATED
  category: Technical
  impact: LOW
  likelihood: LOW
  combined_score: LOW
  mitigating_controls:
    - Change Management Process
    - Separation of Environments
Every field is explicit. Nothing is implied. An auditor can read this without any explanation, and so can a script that generates compliance reports.
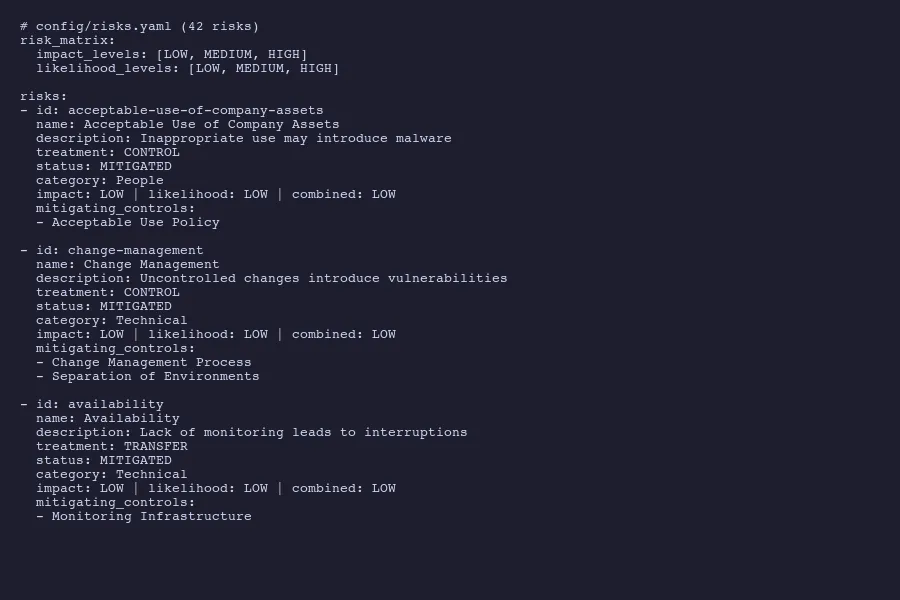
Risk entries from our risks.yaml with treatment plans and mitigating controls
The three risk categories that cover everything
We organize our 42 risks into three buckets: People, Technical, and Policy. That taxonomy isn’t arbitrary. It maps to how risks actually originate in a SaaS organization.
People risks cover human factors. Employees using company assets inappropriately. Social engineering attacks succeeding because someone clicked the wrong link. Access persisting after someone leaves the company. Inadequate security training. Insider threats. These risks exist because humans are involved, and they’re mitigated by policies, training, and access controls.
- id: acceptable-use-of-company-assets
  name: Acceptable Use of Company Assets
  description: Inappropriate use of company owned assets may introduce malware or viruses
  treatment: CONTROL
  status: MITIGATED
  category: People
  impact: LOW
  likelihood: LOW
  combined_score: LOW
  mitigating_controls:
    - Acceptable Use Policy
Technical risks address infrastructure and application-level concerns. Availability failures from poor capacity management. Vulnerabilities introduced through uncontrolled code changes. Data breaches from weak encryption. Network intrusions. System monitoring gaps. These get mitigated by technical controls like monitoring, change management processes, and separation of environments.
- id: availability
  name: Availability
  description: Lack of capacity management can lead to service interruptions
  treatment: TRANSFER
  status: MITIGATED
  category: Technical
  impact: LOW
  likelihood: LOW
  combined_score: LOW
  mitigating_controls:
    - Monitoring Infrastructure
Notice the treatment type there. TRANSFER, not CONTROL. We run on cloud infrastructure, so availability risk gets partially transferred to our cloud provider through their SLAs. The risk treatment decision matters because auditors want to see that you thought about it, not just that you listed a risk and slapped “mitigated” on it.
Policy risks capture organizational and procedural gaps. Business continuity planning. Incident response readiness. Vendor management. Regulatory compliance. These risks exist at the governance level and get mitigated by documented policies that people actually follow.
- id: business-continuity
  name: Business Continuity
  description: Organization may not resume operations after catastrophic event
  treatment: CONTROL
  status: MITIGATED
  category: Policy
  impact: LOW
  likelihood: LOW
  combined_score: LOW
  mitigating_controls:
    - Disaster Recovery Plan
    - Restore
    - Business Continuity
Three categories. Clean separation. Every risk lands in exactly one bucket, and that bucket tells you the general shape of the mitigation strategy before you even read the details. If you want to think about this for your own compliance program, get in touch.
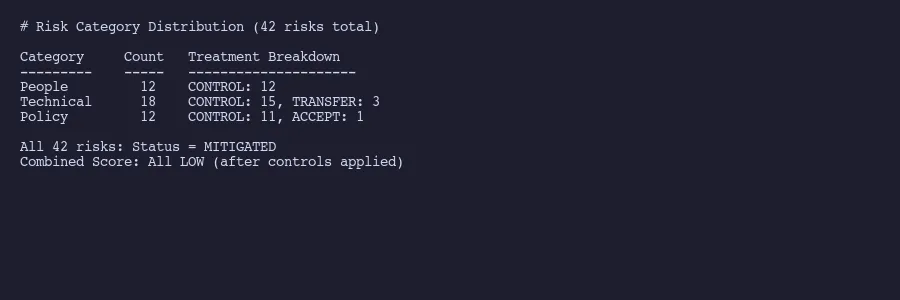
42 risks distributed across People, Technical, and Policy categories
The risk matrix that auditors want to see
Auditors want a documented risk matrix. The AICPA framework expects you to assess each risk on two dimensions: how likely it is to occur and how severe the impact would be.
We use a simple three-level scale. LOW, MEDIUM, HIGH. Some organizations use five-level or even ten-level scales. More granularity isn’t necessarily better. The point is consistency. If you rate one risk as MEDIUM likelihood, the same reasoning should apply to every risk rated MEDIUM.
The combined score follows a straightforward matrix:
| LOW impact | MEDIUM impact | HIGH impact | |
|---|---|---|---|
| LOW likelihood | LOW | LOW | MEDIUM |
| MEDIUM likelihood | LOW | MEDIUM | HIGH |
| HIGH likelihood | MEDIUM | HIGH | HIGH |
All 42 of our risks currently score LOW combined. That’s not because we’re ignoring threats. It’s because every identified risk has mitigating controls in place that reduce both the likelihood and the impact to acceptable levels.
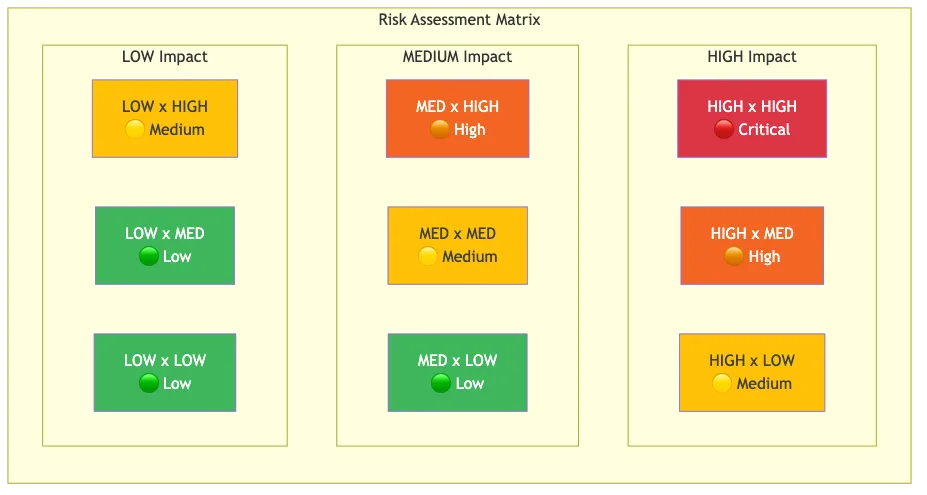
Risk assessment matrix mapping impact against likelihood
And “acceptable” isn’t wishful thinking. It means the controls are documented, implemented, tested, and producing evidence that auditors can examine. A risk scored LOW with no controls is a red flag. A risk scored LOW with two or three specific controls mapped to it is a functioning risk management program. The controls then connect to evidence collection that proves each one operates effectively.
The matrix also helps surface risks that need attention. If a control fails or weakens, the risk score shifts. A MEDIUM combined score on any risk triggers a review. A HIGH score requires a formal treatment plan with a timeline and an owner. The YAML structure makes this trivially easy to query and filter, which is something you can’t say about a color-coded Excel heatmap.
Mapping risks to mitigating controls
This is where most risk assessments fall apart. Companies list risks in one document and controls in another, with no explicit connection between them. An auditor asks “what controls mitigate your change management risk?” and someone has to manually trace the relationship across multiple spreadsheets.
Our YAML structure solves this by embedding the control mapping directly in each risk entry. The mitigating_controls field is a list of specific control names. Those same names appear in our controls register, creating a bidirectional link. Start from a risk and you can see every control that addresses it. Start from a control and you can see every risk it mitigates.
This is where AI proves useful. When we add a new risk or modify an existing one, AI reviews the full controls inventory and suggests which controls apply. It catches connections that humans miss. A risk about “unauthorized system access” might be mitigated not just by access control policies but also by monitoring infrastructure, employee onboarding procedures, and regular access reviews. AI surfaces those less obvious relationships because it can hold the entire register in context simultaneously. We use this same approach for AI-assisted evidence collection across the full compliance program.
The mapping also reveals coverage gaps. If a control only mitigates one risk, that’s fine. If a risk has zero mitigating controls, that’s a problem. If ten risks all depend on a single control, that control becomes critical infrastructure for your compliance program.
Here’s a real example of multi-control mitigation:
- id: change-management
  name: Change Management
  description: Changes without appropriate oversight introduce vulnerabilities
  treatment: CONTROL
  status: MITIGATED
  category: Technical
  impact: LOW
  likelihood: LOW
  combined_score: LOW
  mitigating_controls:
    - Change Management Process
    - Separation of Environments
Two controls. One ensures changes go through review and approval. The other ensures development, staging, and production environments stay separate so untested changes can’t reach customers. Together they reduce both the likelihood and impact of uncontrolled changes. Neither alone would be sufficient.
This is the thinking auditors want to see. Not just “we have controls” but “we understand which risks each control addresses and why that combination is sufficient.” The NIST Risk Management Framework describes this as establishing clear relationships between identified risks and the controls selected to address them.
Why structured data beats risk assessment spreadsheets
A 2024 analysis from Wissda documented four recurring failure modes in spreadsheet-based risk management: siloed data that prevents enterprise visibility, poor data quality from manual entry errors, scalability limits as risk registers grow, and lack of real-time insights.
We’ve seen all of these firsthand. Before switching to YAML, our risk register lived in a shared spreadsheet. Someone added a risk without filling in the treatment column. Someone else changed a control name in the controls sheet but not in the risk register, breaking the mapping. Conditional formatting hid empty cells. The auditor flagged three risks with missing mitigating controls that turned out to be formatting issues, not actual gaps. Two hours of everyone’s time wasted.
Structured data eliminates entire categories of these problems.
Version control. Every change to the risk register creates a Git commit with a timestamp, author, and description. Auditors can see exactly who modified a risk assessment and when. Try doing that with a shared spreadsheet. The AICPA expects that risk assessments are reviewed and updated within the audit period. Git history proves that definitively.
Validation. A YAML schema can enforce required fields. If someone adds a risk without a treatment strategy, the validation fails. No more half-completed entries lurking in your register.
Automation. Scripts can generate risk matrices, calculate coverage statistics, and produce auditor-ready reports from the same YAML source. Our AI tooling generates compliance narratives directly from the structured data. NIST has been pushing toward machine-readable compliance formats through OSCAL for exactly this reason.
Querying. Want all Technical risks with MEDIUM or higher combined scores? That’s a one-line filter. Want all risks mitigated by the Acceptable Use Policy? Another one-line query. In a spreadsheet, these questions require manual sorting, filtering, and hoping nobody hid any rows.
Consistency. The YAML structure enforces a uniform format. Every risk has the same fields. Every treatment uses the same vocabulary (CONTROL, TRANSFER, ACCEPT). Every category draws from the same set. Spreadsheets drift. Structured data doesn’t.
The compliance-as-code movement is heading this direction broadly. Embedding compliance checks into development pipelines, expressing requirements in machine-readable formats, treating security controls as testable assertions rather than checkbox documentation. Our risk register in YAML is a small but concrete expression of that principle.
42 risks. Three categories. Explicit control mappings. Machine-readable format with full version history. That’s what a functioning SOC 2 risk assessment looks like when you stop treating compliance as paperwork and start treating it as structured data.
About the Author
Amit Kothari is an experienced consultant, advisor, coach, and educator specializing in AI and operations for executives and their companies. With 25+ years of experience and as the founder of Tallyfy (raised $3.6m), he helps mid-size companies identify, plan, and implement practical AI solutions that actually work. Originally British and now based in St. Louis, MO, Amit combines deep technical expertise with real-world business understanding.
Disclaimer: The content in this article represents personal opinions based on extensive research and practical experience. While every effort has been made to ensure accuracy through data analysis and source verification, this should not be considered professional advice. Always consult with qualified professionals for decisions specific to your situation.